File:Wilson1w2Fig5.png

Size of this preview: 800 × 391 pixels. Other resolutions: 320 × 156 pixels | 1,330 × 650 pixels.
Original file (1,330 × 650 pixels, file size: 197 KB, MIME type: image/png)
Summary
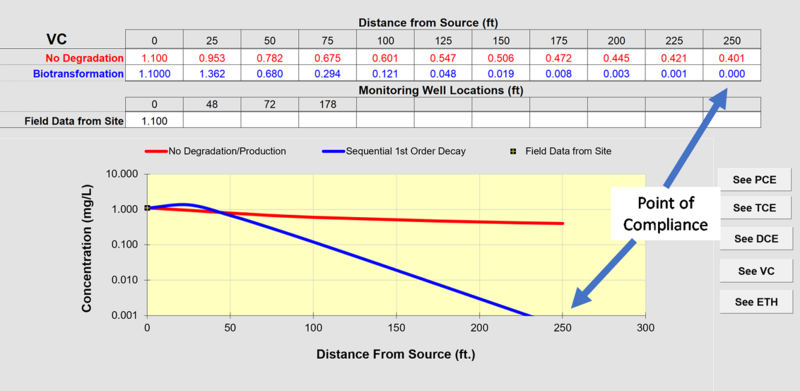
Figure 5. Output of the RUN CENTERLINE simulation of conditions after an active remedy was implemented with a source concentration of 1.1 mg/L, projecting the concentration of vinyl chloride at a distance corresponding to a point-of-compliance well.
File history
Click on a date/time to view the file as it appeared at that time.
| Date/Time | Thumbnail | Dimensions | User | Comment | |
|---|---|---|---|---|---|
| current | 16:19, 9 January 2020 |  | 1,330 × 650 (197 KB) | Debra Tabron (talk | contribs) | Figure 5. Output of the RUN CENTERLINE simulation of conditions after an active remedy was implemented with a source concentration of 1.1 mg/L, projecting the concentration of vinyl chloride at a distance corresponding to a point-of-compliance well. |
- You cannot overwrite this file.
File usage
The following page links to this file: