File:Wilson1w2Fig1.png
Size of this preview: 800 × 559 pixels. Other resolutions: 320 × 224 pixels | 1,020 × 713 pixels.
Original file (1,020 × 713 pixels, file size: 55 KB, MIME type: image/png)
Summary
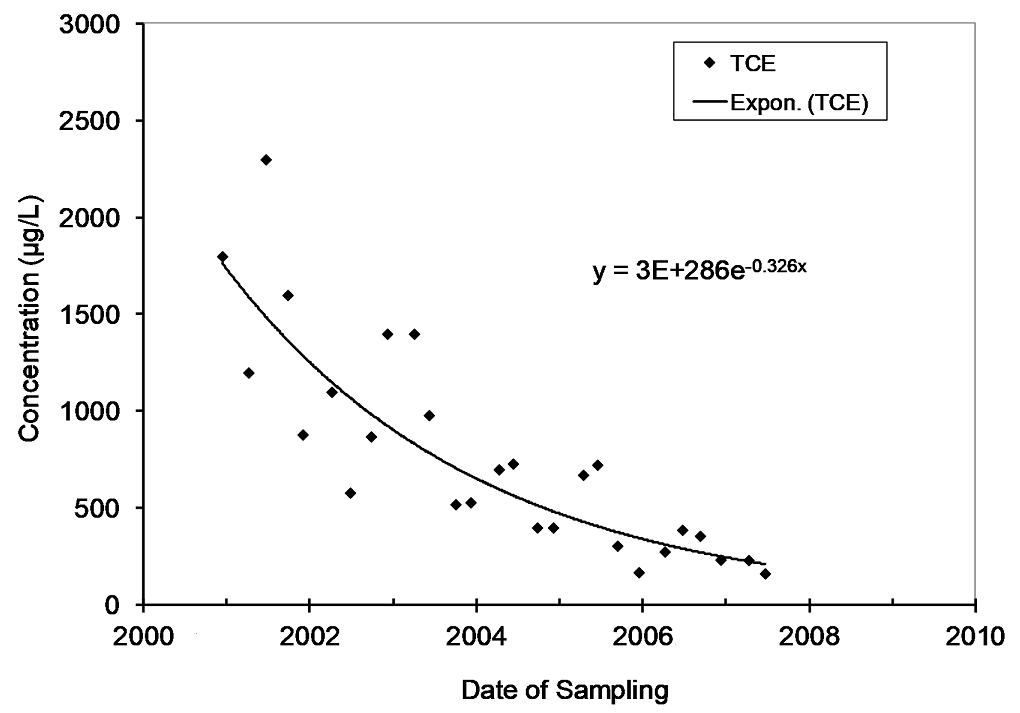
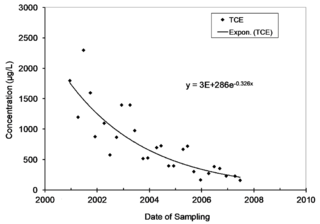
Figure 1. Attenuation of Trichloroethene (TCE) over time in a monitoring well at a site in Michigan. The concentration vs. time rate constant is 0.326 per year and largely represents the rate of the attenuation of the source of contaminants in the aquifer.
File history
Click on a date/time to view the file as it appeared at that time.
| Date/Time | Thumbnail | Dimensions | User | Comment | |
|---|---|---|---|---|---|
| current | 17:00, 9 January 2020 | | 1,020 × 713 (55 KB) | Debra Tabron (talk | contribs) | Figure 1. Attenuation of Trichloroethene (TCE) over time in a monitoring well at a site in Michigan. The concentration vs. time rate constant is 0.326 per year and largely represents the rate of the attenuation of the source of contaminants in the aq... |
- You cannot overwrite this file.
File usage
The following page links to this file: